Performing Exploratory analysis without writing a line of code
Ever had a great idea but felt held back by your lack of coding skills? Not any more! Current AI-powered tools based on large language models (LLMs) can turn your 'plain English' instructions into functional code, making programming accessible to everyone. In this post, I will show you how to perform exploratory data analysis without writing a single line of code.
There are many LLM-based tools available, for this example I selected ChatGPT as it may be the most (or one othe most) used one, but you should be able to do a similar analysis in any of them.
ChatGPT example
For this example, I selected R coding - Advanced AI Assistant since I will be performing calculations in R. If you use the standard version of ChatGPT, it will default to Python unless you specify a different language.
we can directly ask ChatGPT what we need to do, see the following example:
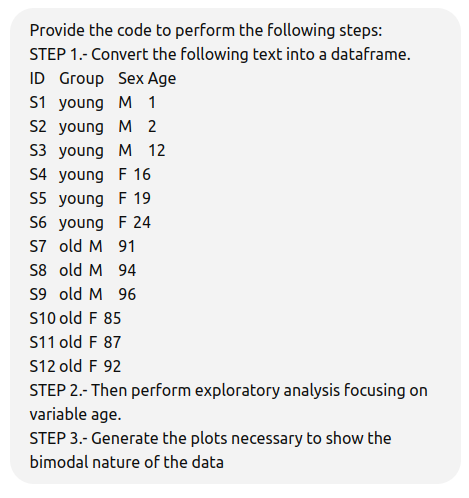
and it will provide the whole code for us. Then we just need to copy and paste it in R.
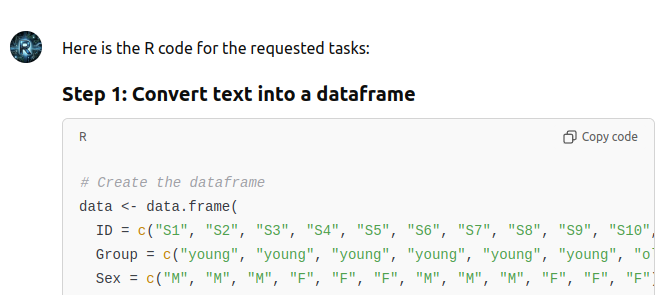
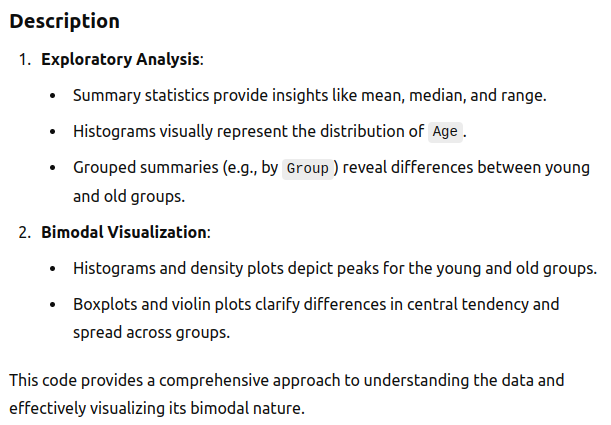
ChatGPT will even explain it to you.
Let's try the proposed code:
For step 1: It starts loading the provided data and then prints it.
 1# Create the dataframe
 2data <- data.frame(
 3  ID = c("S1", "S2", "S3", "S4", "S5", "S6", "S7", "S8", "S9", "S10", "S11", "S12"),
 4  Group = c("young", "young", "young", "young", "young", "young", "old", "old", "old", "old", "old", "old"),
 5  Sex = c("M", "M", "M", "F", "F", "F", "M", "M", "M", "F", "F", "F"),
 6  Age = c(1, 2, 12, 16, 19, 24, 91, 94, 96, 85, 87, 92)
 7)
 8data
 9##     ID Group Sex Age
10## 1   S1 young   M   1
11## 2   S2 young   M   2
12## 3   S3 young   M  12
13## 4   S4 young   F  16
14## 5   S5 young   F  19
15## 6   S6 young   F  24
16## 7   S7   old   M  91
17## 8   S8   old   M  94
18## 9   S9   old   M  96
19## 10 S10   old   F  85
20## 11 S11   old   F  87
21## 12 S12   old   F  92
For step 2: It summarizes the data.
1# Summary statistics
2summary(data$Age)
3##    Min. 1st Qu.  Median    Mean 3rd Qu.    Max.
4##    1.00   15.00   54.50   51.58   91.25   96.00
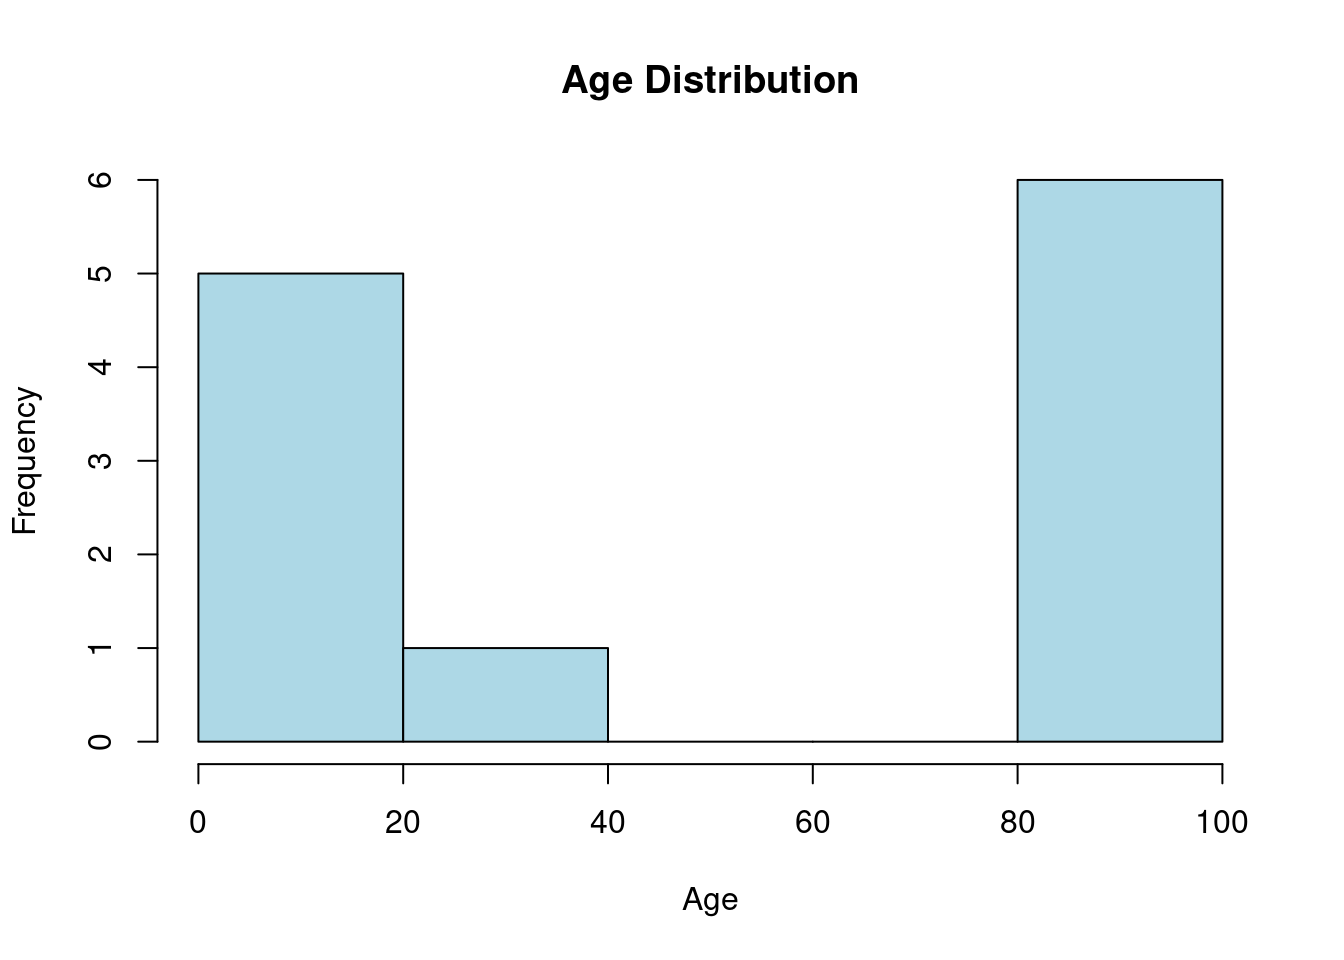
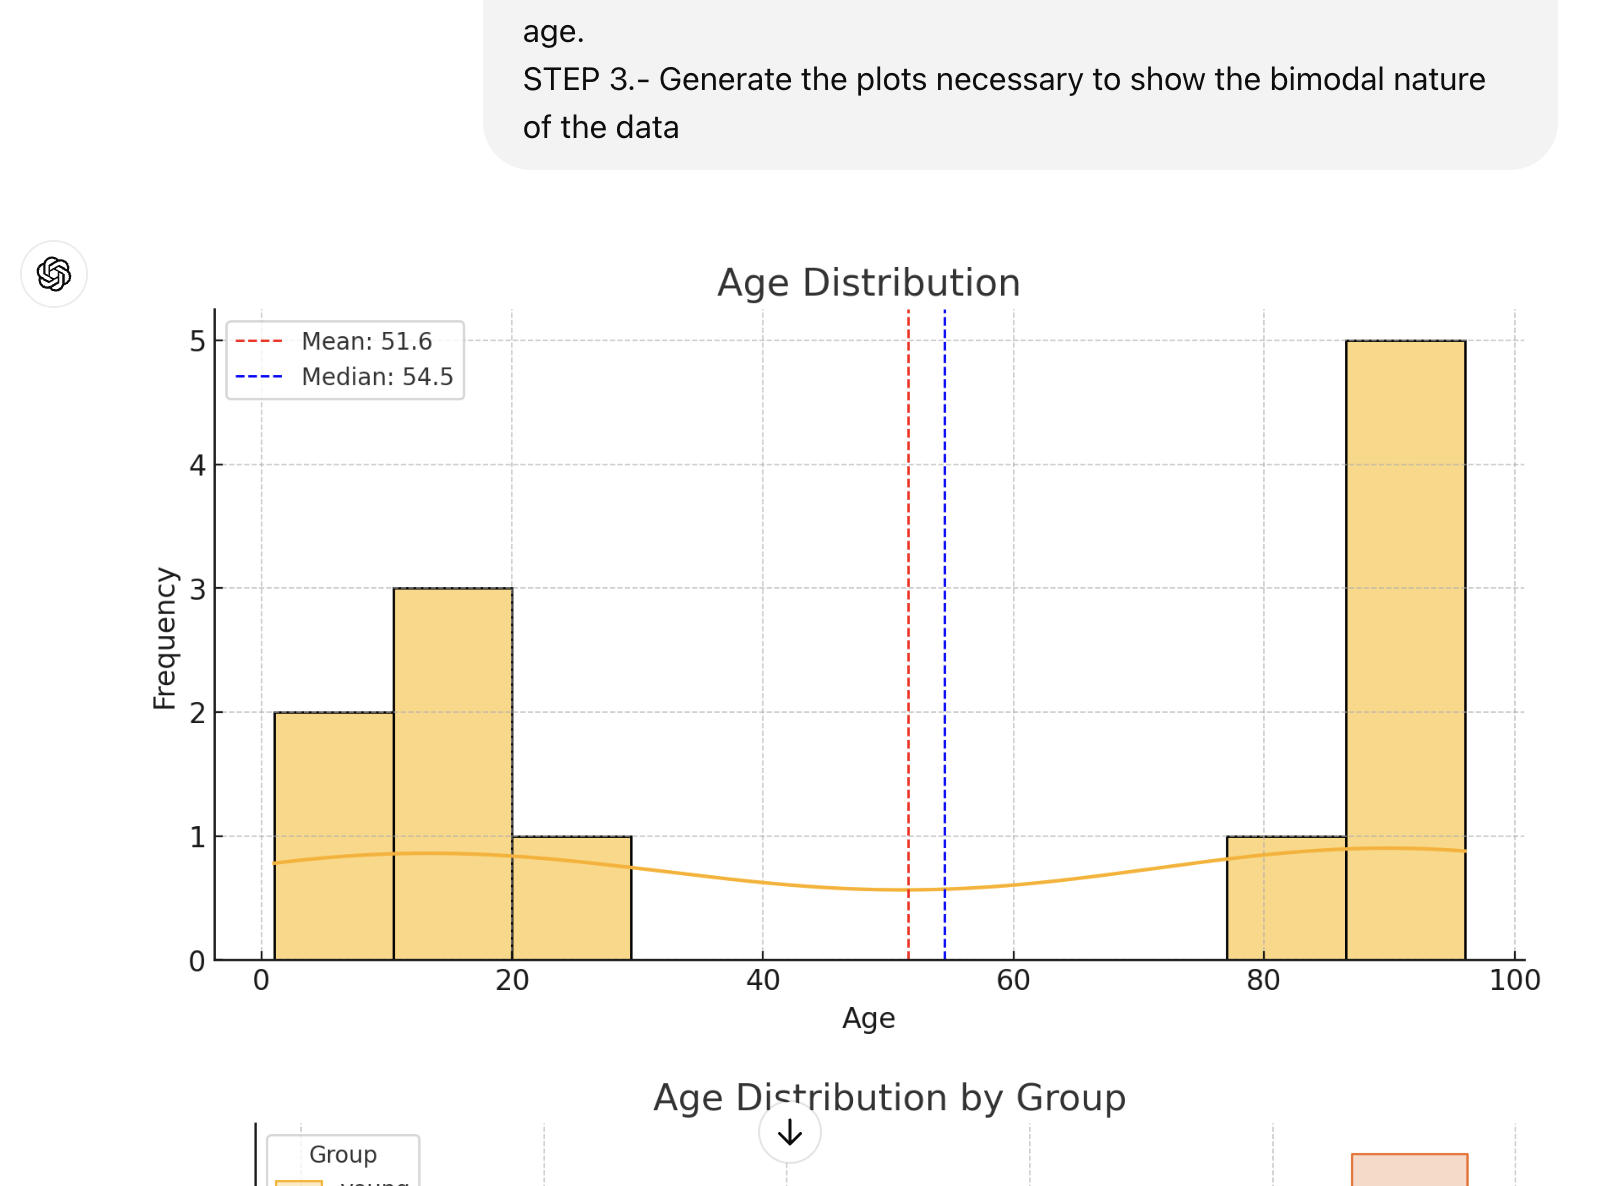
next, it generates a histogram of the data.
1# Check distribution
2hist(data$Age, main = "Age Distribution", xlab = "Age", col = "lightblue", border = "black")
And finally, it provides some statistics based on the groups.
1# Group-based statistics
2aggregate(Age ~ Group, data = data, summary)
3##   Group Age.Min. Age.1st Qu. Age.Median Age.Mean Age.3rd Qu. Age.Max.
4## 1   old 85.00000    88.00000   91.50000 90.83333    93.50000 96.00000
5## 2 young  1.00000     4.50000   14.00000 12.33333    18.25000 24.00000
For step 3: Plot generation, it starts by loading the required library.
1library(ggplot2)
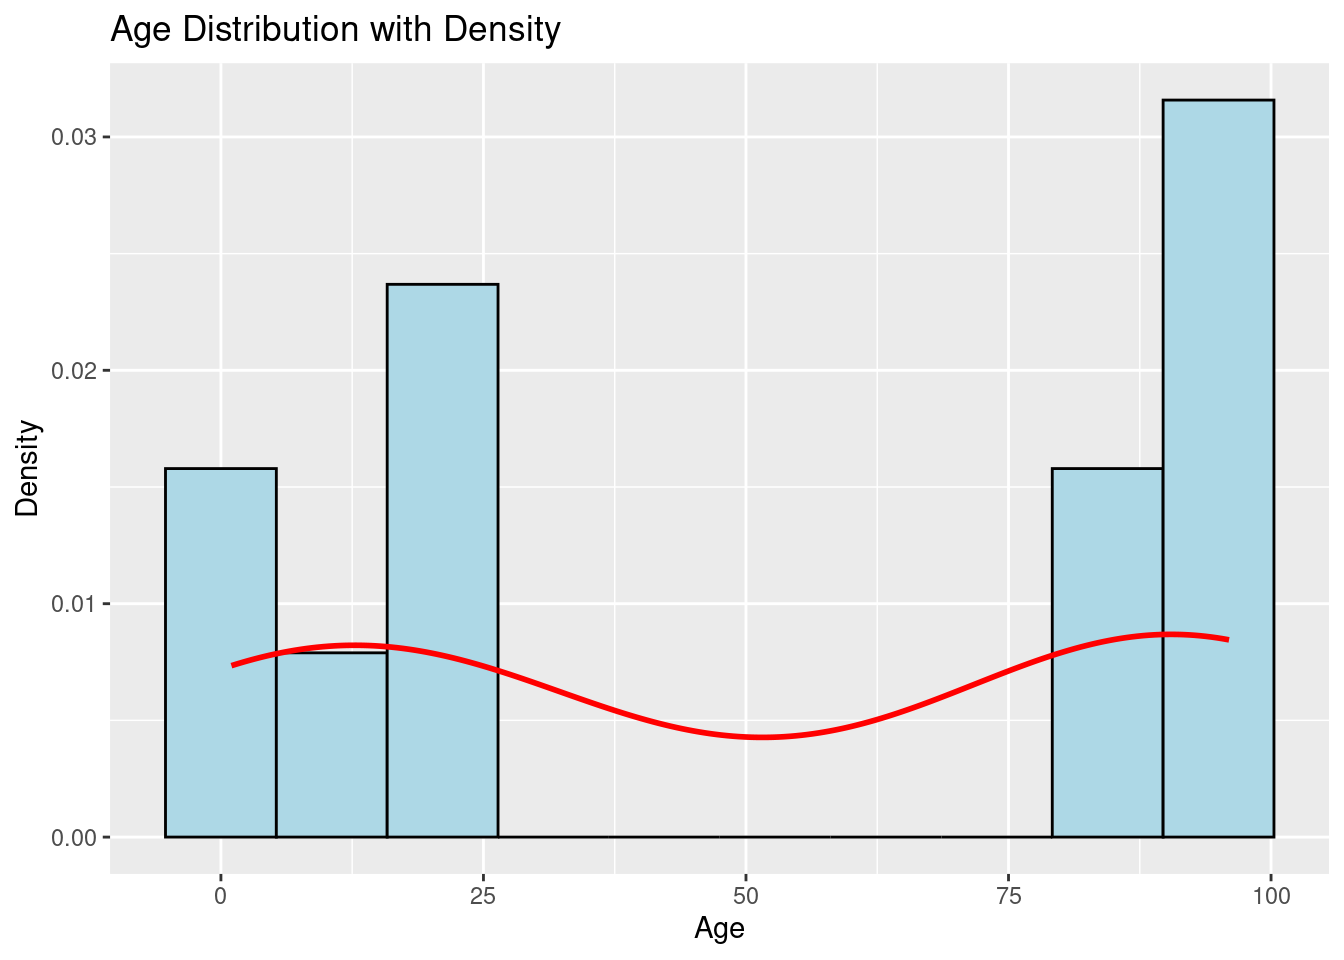
Next suggests doing a histogram with density plot using ggplot.
 1# Histogram with density plot
 2ggplot(data, aes(x = Age)) +
 3  geom_histogram(aes(y = ..density..), bins = 10, fill = "lightblue", color = "black") +
 4  geom_density(color = "red", size = 1) +
 5  ggtitle("Age Distribution with Density") +
 6  xlab("Age") +
 7  ylab("Density")
 8## Warning: Using `size` aesthetic for lines was deprecated in ggplot2 3.4.0.
 9## ℹ Please use `linewidth` instead.
10## This warning is displayed once every 8 hours.
11## Call `lifecycle::last_lifecycle_warnings()` to see where this warning was
12## generated.
13## Warning: The dot-dot notation (`..density..`) was deprecated in ggplot2 3.4.0.
14## ℹ Please use `after_stat(density)` instead.
15## This warning is displayed once every 8 hours.
16## Call `lifecycle::last_lifecycle_warnings()` to see where this warning was
17## generated.
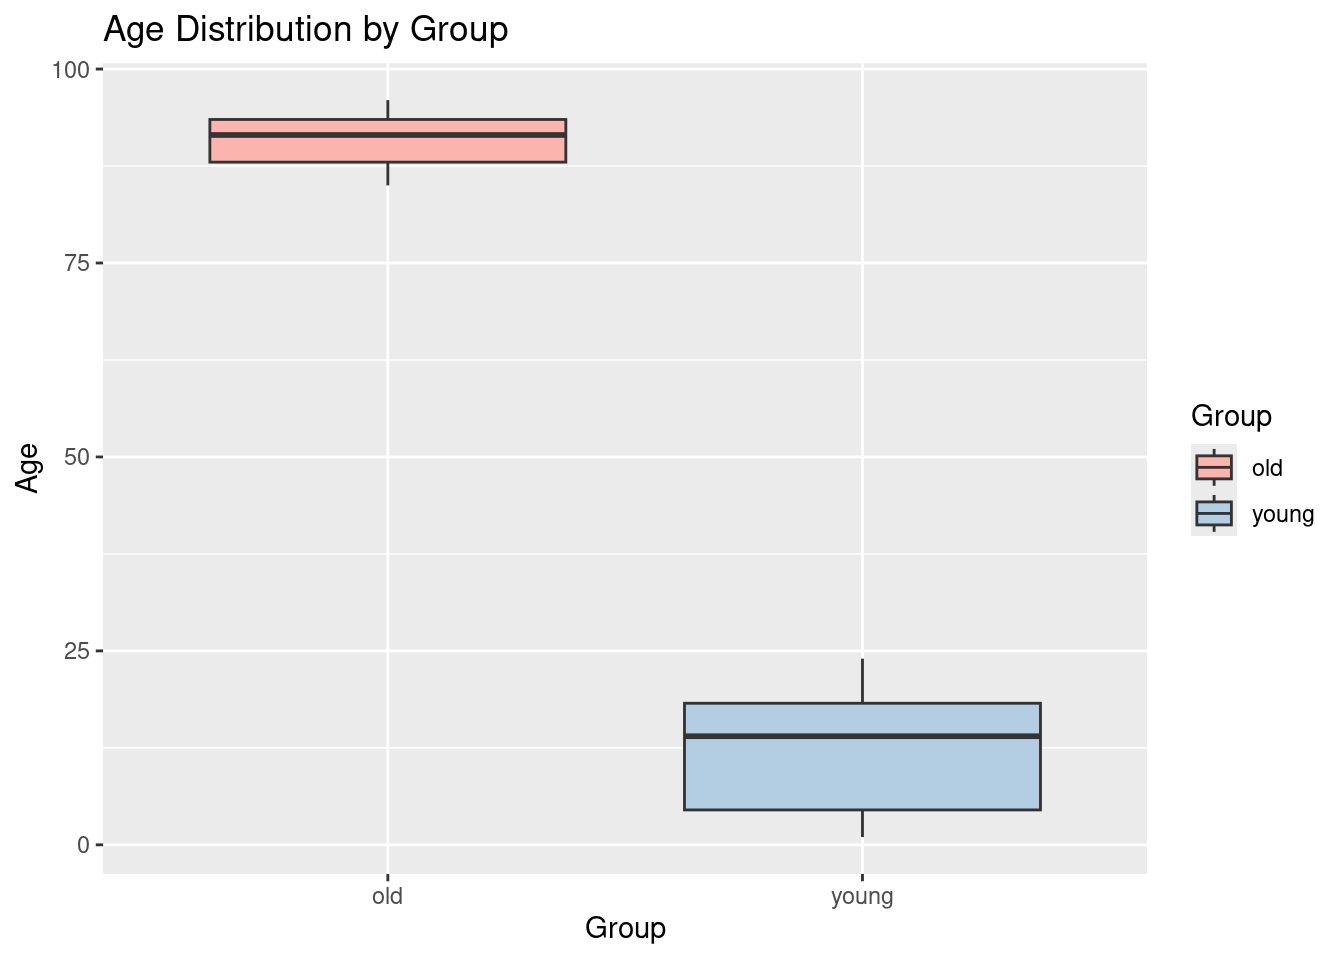
a boxplot
1# Boxplot by group
2ggplot(data, aes(x = Group, y = Age, fill = Group)) +
3  geom_boxplot() +
4  ggtitle("Age Distribution by Group") +
5  xlab("Group") +
6  ylab("Age") +
7  scale_fill_brewer(palette = "Pastel1")
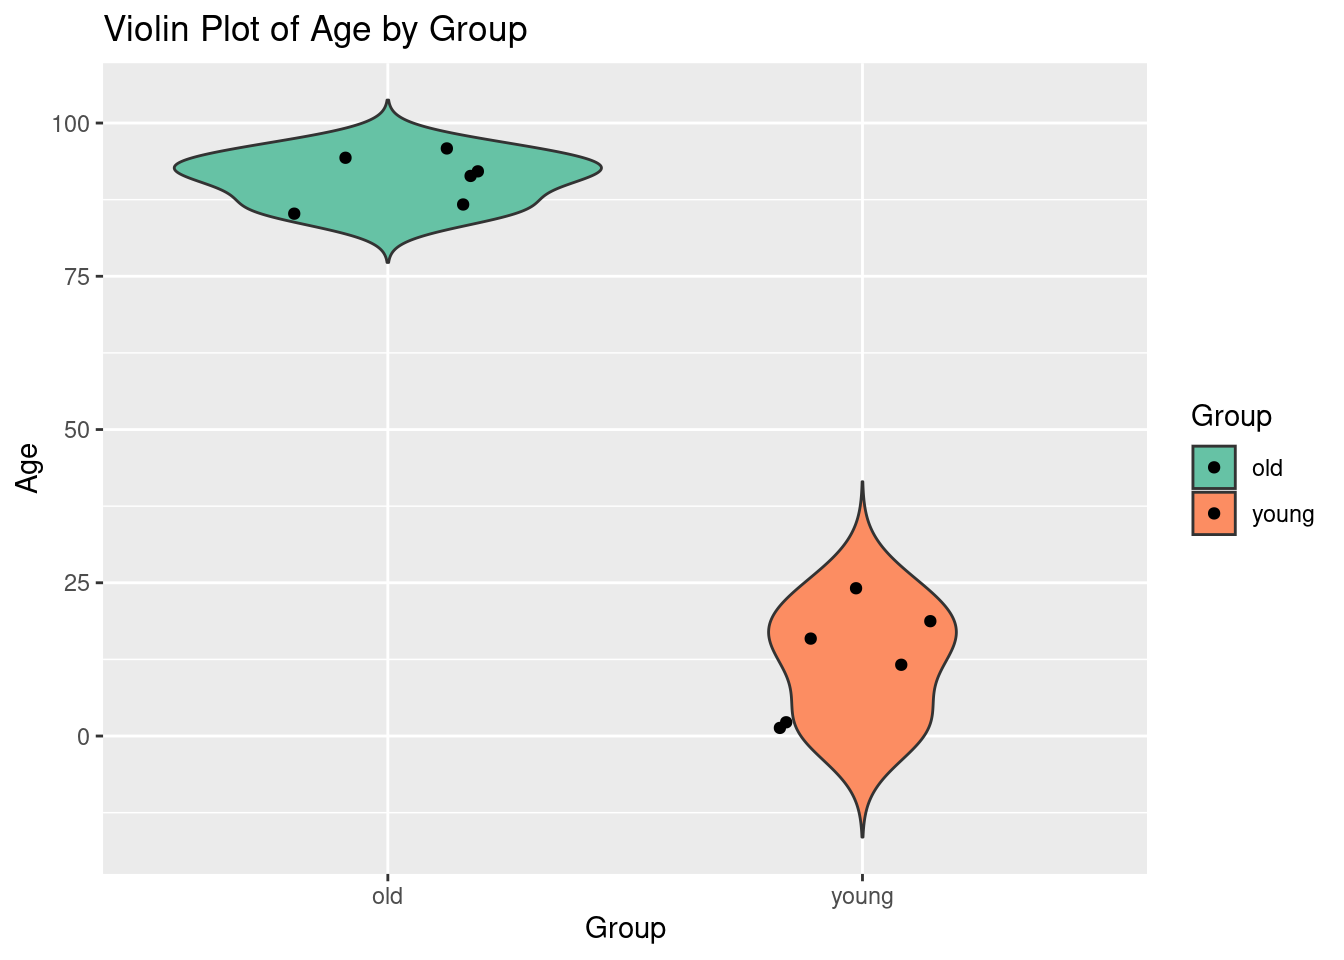
and a violin plot.
1# Violin plot for further visualization
2ggplot(data, aes(x = Group, y = Age, fill = Group)) +
3  geom_violin(trim = FALSE) +
4  geom_jitter(width = 0.2) +
5  ggtitle("Violin Plot of Age by Group") +
6  xlab("Group") +
7  ylab("Age") +
8  scale_fill_brewer(palette = "Set2")
We can now ask for specific modification if something is not as we need.
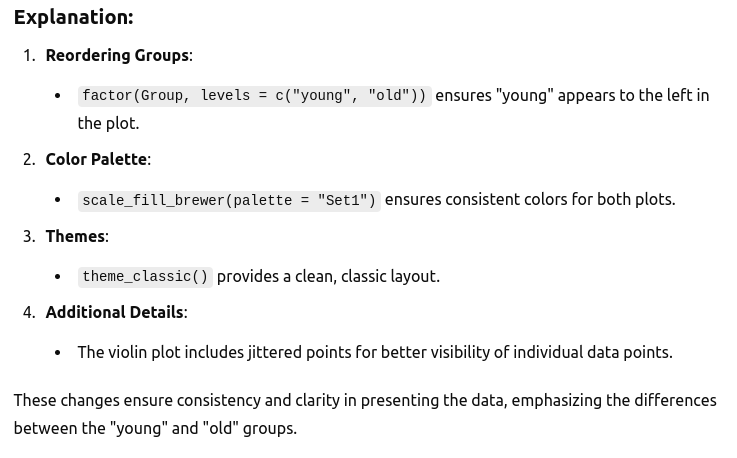
We start by modifying the plots generated by chatgpt to reorder the groups, keep consistent colors and use a classic theme.

again ChatGPT will provide the code for us
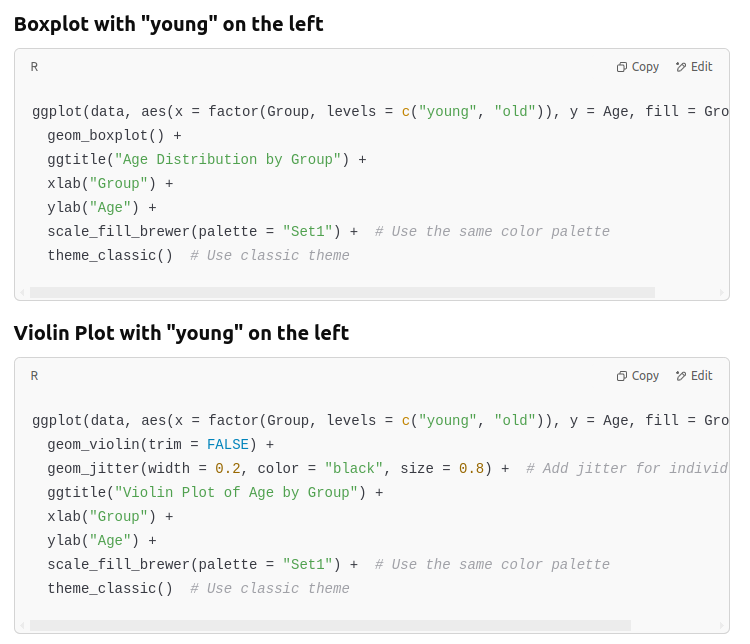
with its explanation
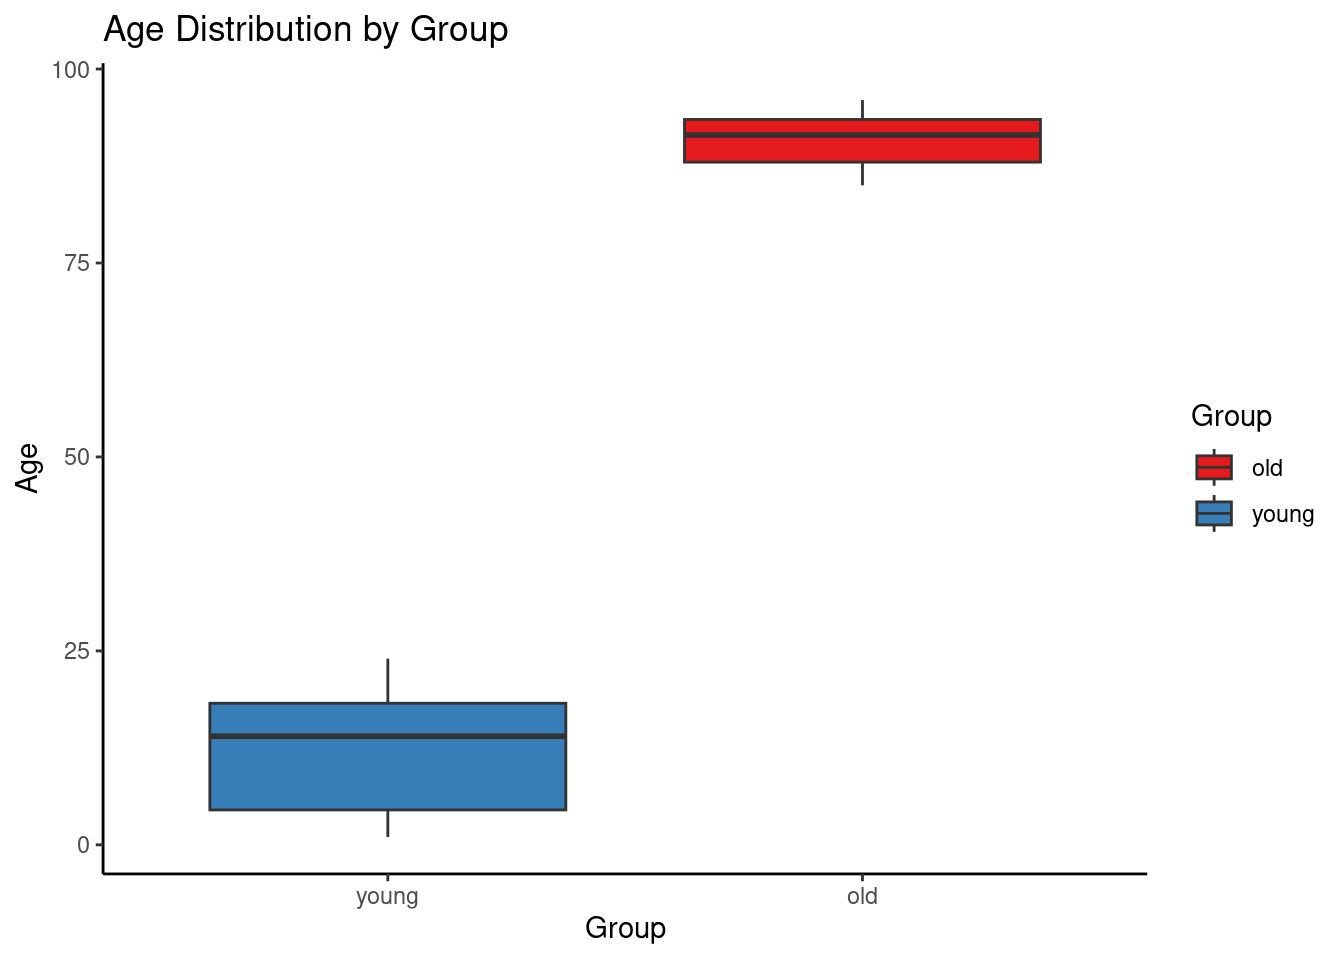
1ggplot(data, aes(x = factor(Group, levels = c("young", "old")), y = Age, fill = Group)) +
2  geom_boxplot() +
3  ggtitle("Age Distribution by Group") +
4  xlab("Group") +
5  ylab("Age") +
6  scale_fill_brewer(palette = "Set1") +  # Use the same color palette
7  theme_classic()  # Use classic theme
1
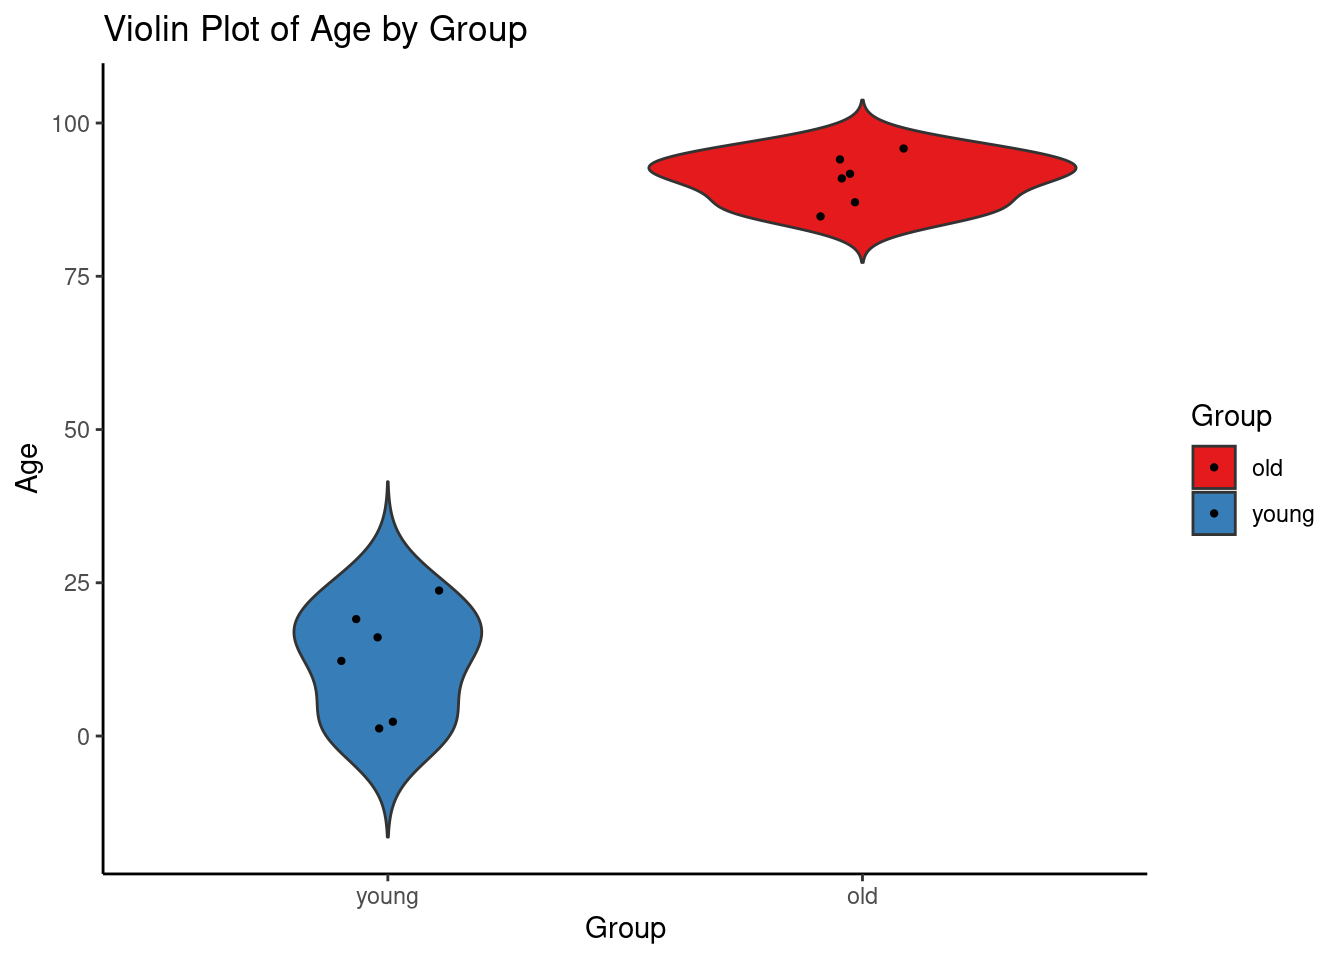
2ggplot(data, aes(x = factor(Group, levels = c("young", "old")), y = Age, fill = Group)) +
3 geom_violin(trim = FALSE) +
4 geom_jitter(width = 0.2, color = "black", size = 0.8) + # Add jitter for individual points
5 ggtitle("Violin Plot of Age by Group") +
6 xlab("Group") +
7 ylab("Age") +
8 scale_fill_brewer(palette = "Set1") + # Use the same color palette
9 theme_classic() # Use classic theme
We can also ask for a new plot to generate a density plot.

Here is the answer from ChatGPT
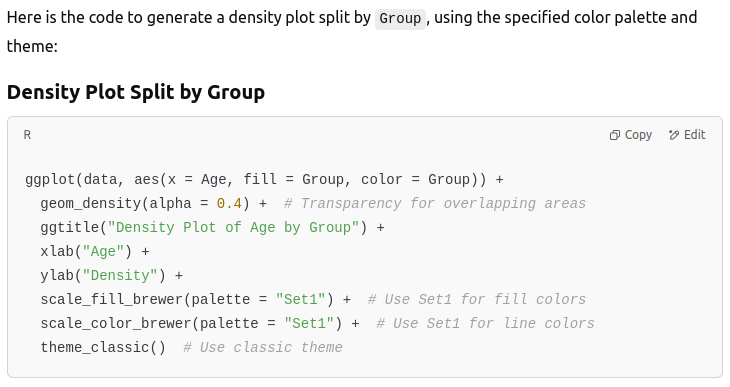
with its explanation
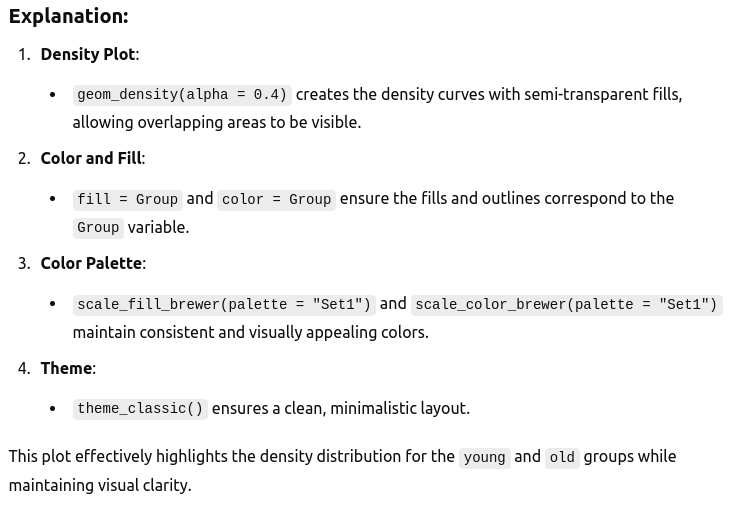
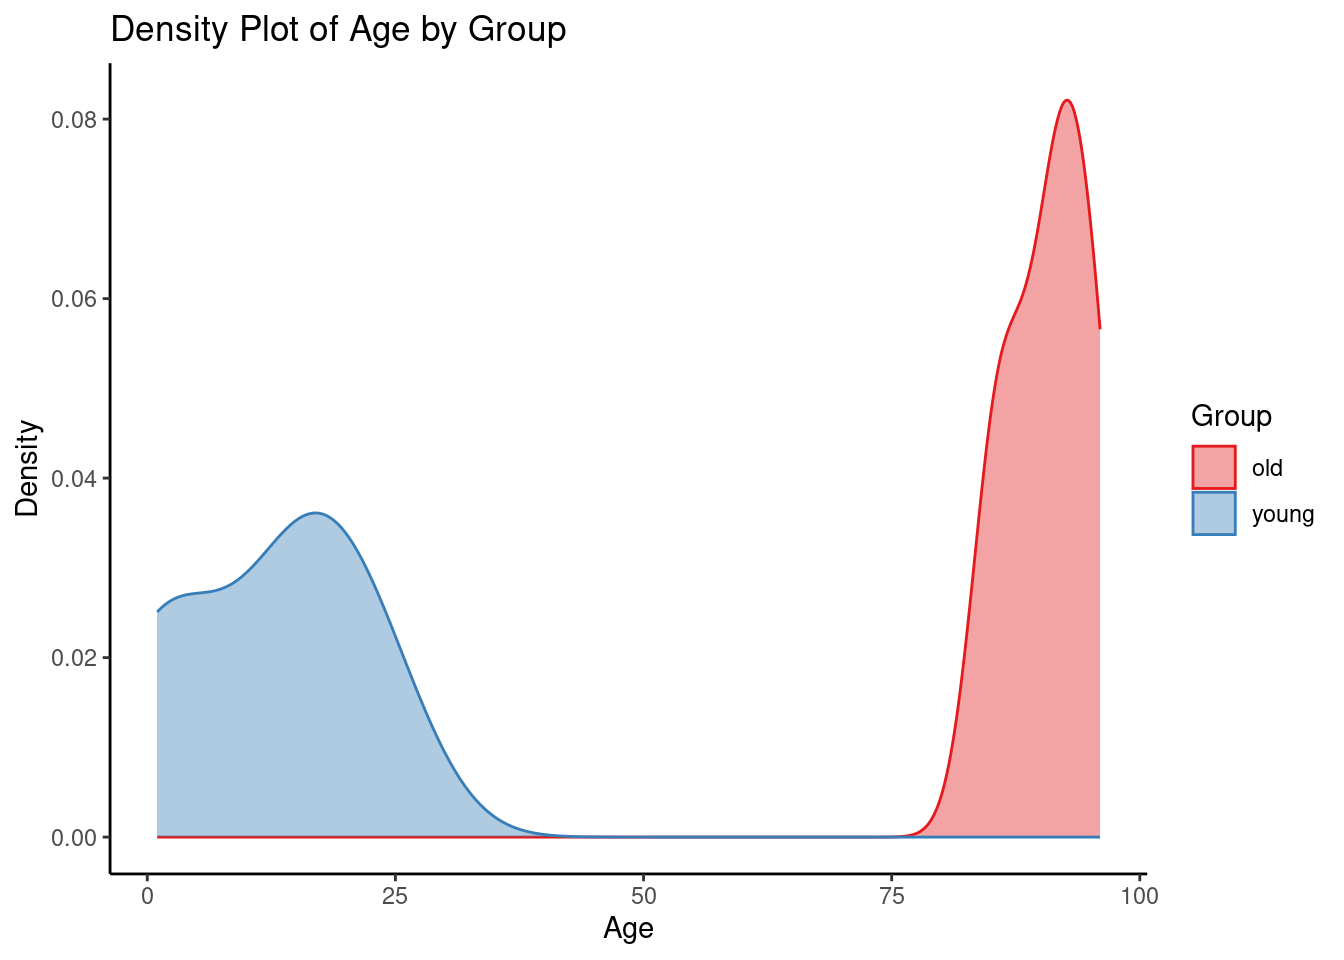
let's see the code in action
1ggplot(data, aes(x = Age, fill = Group, color = Group)) +
2  geom_density(alpha = 0.4) +  # Transparency for overlapping areas
3  ggtitle("Density Plot of Age by Group") +
4  xlab("Age") +
5  ylab("Density") +
6  scale_fill_brewer(palette = "Set1") +  # Use Set1 for fill colors
7  scale_color_brewer(palette = "Set1") +  # Use Set1 for line colors
8  theme_classic()  # Use classic theme
But we can go longer and ask to suggest packages to directly make a publishable table.
ChatGPT will return a recommendation for a package to generate a summary table, including the code and explanation of the output.
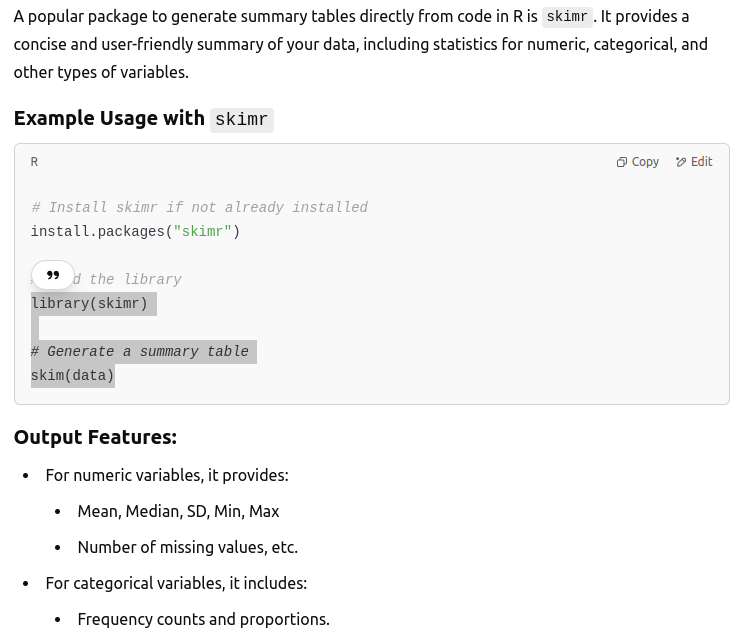
1library(skimr)
2
3# Generate a summary table
4skim(data)
Table: Table 1: Data summary
| Name | data |
| Number of rows | 12 |
| Number of columns | 4 |
| _______________________ | |
| Column type frequency: | |
| character | 3 |
| numeric | 1 |
| ________________________ | |
| Group variables | None |
Variable type: character
| skim_variable | n_missing | complete_rate | min | max | empty | n_unique | whitespace |
|---|---|---|---|---|---|---|---|
| ID | 0 | 1 | 2 | 3 | 0 | 12 | 0 |
| Group | 0 | 1 | 3 | 5 | 0 | 2 | 0 |
| Sex | 0 | 1 | 1 | 1 | 0 | 2 | 0 |
Variable type: numeric
| skim_variable | n_missing | complete_rate | mean | sd | p0 | p25 | p50 | p75 | p100 | hist |
|---|---|---|---|---|---|---|---|---|---|---|
| Age | 0 | 1 | 51.58 | 41.56 | 1 | 15 | 54.5 | 91.25 | 96 | ▇▁▁▁▇ |
along with alternatives
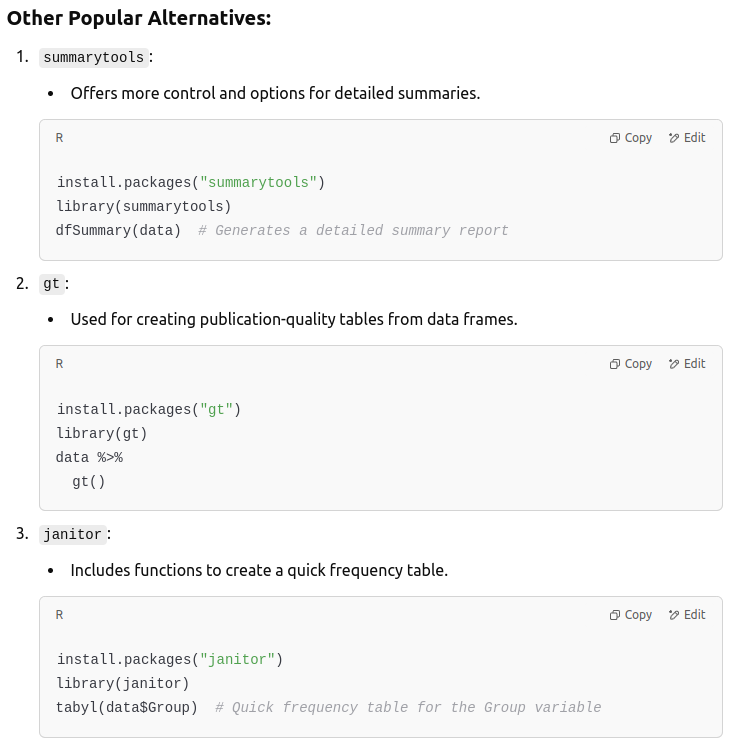
and a recommendation.

We can draw now some conclusions from the analysis, the age of the old group is clearly higher than the age of the young group.
This was very clear example but, in more complex scenarios, you can always ask ChatGPT to draw conclusions about the data
Based on your analysis, what can you conclude about the data?
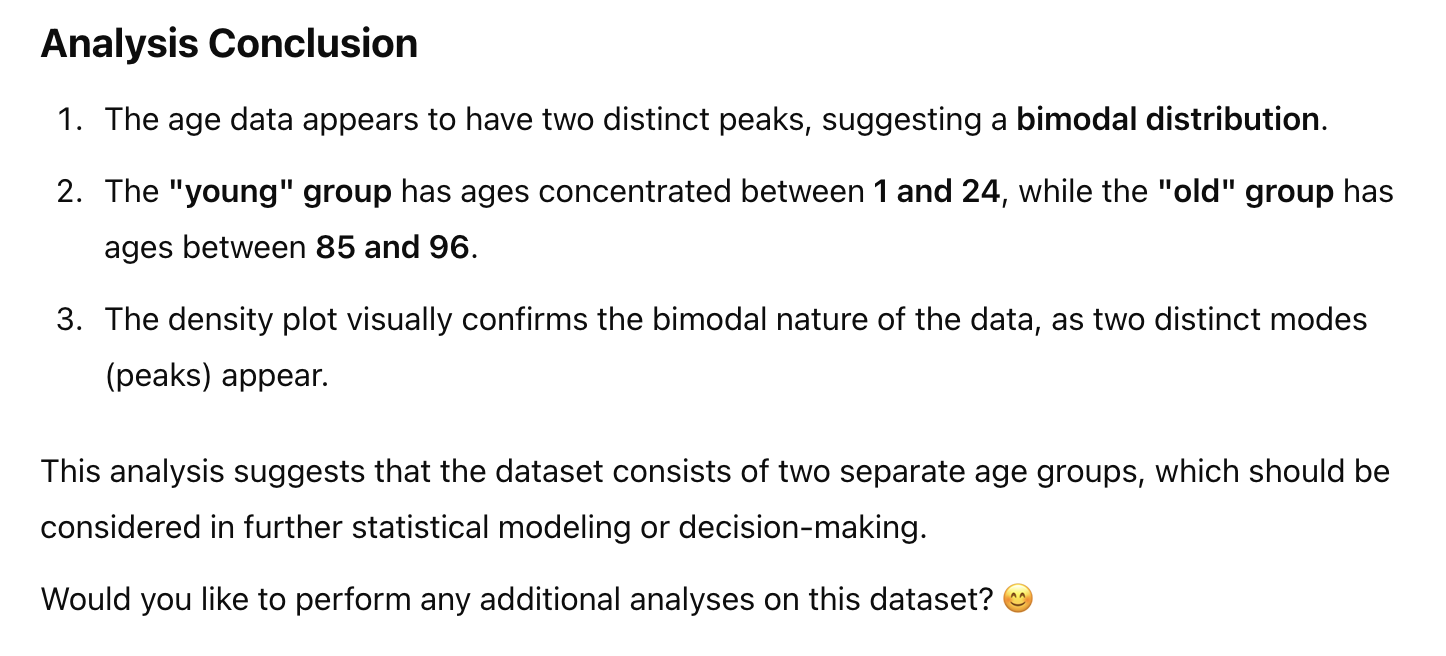
As you can see, it draws quite accurate conclusions and even ask (emoji included) if we would like to do additional analyses. Let's ask about suggestions!
Suggest additional analyses for this dataset
It returns more than 10 suggestions, including the code to perform them, ranging from 'simple' plots to more complex analyses. Below some examples:

Too lazy? you can even talk to ChatGPT using the advanced voice mode instead of typing. I have not tried this myselft. If you do, let me know in the comments section

This sounds familiar to me, doesn't it?

Even more lazy? Let him to do the computation for you (as already said, it will run python code)
Sanity check
It’s important to check the code, the conclusions and any output ChatGPT, or any other LLM, produces (search online for hallucinations if you have not heard about them). While advanced, it still can produce misleading output. Asking ChatGPT to work step by step, explain the output, and double check the work is a good option to try to get better results.
In any case, you should click on "show work" to see the code used to produce the results. This allows you to see all the steps of the code and test it if something is unclear to you.
Final thoughts
And, that’s it!
Hopefully this example gave you some good ideas how to use ChatGPT, or any other LLM, for data analysis. LLMs are not perfect so remember to double check and evaluate the outputs. However, when used effectively, they can significantly help you, provide differnt perspectives, and assist in exploring complex datasets. So go ahead, experiment, and see how AI can help!
And don't forget to let us know in the comments section below!!